See and Understand What Drives Product Performance

Materials + Process Conditions = Product Properties

In a simple but effective view, what materials you use under what process conditions give rise to “Quality”; the properties of your products and how they relate to specifications. While this is a simple view, reality suggests most manufacturing operations use many materials, each with many properties themselves, and have 100’s of process variables. Adding more complexity, it is very common that materials and process conditions have non-linear effects on your product properties and further yet, materials and process conditions interact with each other in a complex dance. In the end even simple products can be complex puzzles, sometimes ones you end up solving at 3 AM. Does it sound like we know what we are talking about? Yes, thanks. We’ve been there, done that (and still do).

In Brief

Products Used

Using Data Driven Approaches To Estimating Product Properties

Many product properties have no theoretical basis. This means there is no “theoretical equation” for how materials and process conditions result in the characteristics of what you produce. Even if there were a theoretical basis, using data-driven approaches have keen advantages; data-driven is easier to do, faster, more accurate and tuned to each individual process and product. Even if you did have a “magic formula”, it would need to be “calibrated” to match the actual relations.

“Data-Driven” means you use actual materials and process conditions to map them to each of your products’ properties, the mapping done in our case with sophisticated self-optimizing non-linear modeling technologies that accomodate for full interactions. Feeding this modeling process you can use theoretical equations, should any exist and enforce “rules of thumb”, if they are valid. “Rules of thumb” mean basic relations are known, such as increasing X results in decreasing Y. However, we caution about “rules of thumb”, as we have found that they are often conditional or just wrong, about 1/2 the time… Something as simple and “common sense” as “Opening the valve results in increased flow” is not always true, measurably, particularly if the valve is open quite a lot already and other factors are afoot. In other cases correlation reverses based on the degree or effects of other variables.

See the Effects to Understand

The first step in understanding how process conditions and materials affect your products’ quality is to merely look at it; visualization. In our software this is easy, extract the data (from various sources such as OSISoft PI, SQL Server, text, Excel,…), clean it up a bit (some art here) and select variables and start plotting; trends, histograms and most importantly scatter plots.

Scatter PlotTrend PlotHistogram Plot

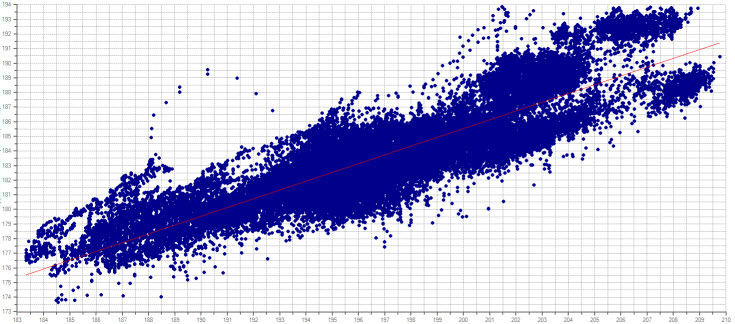
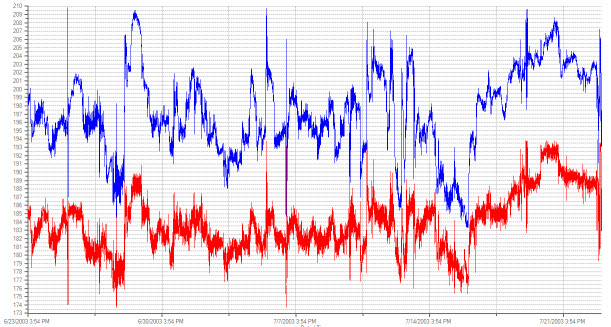
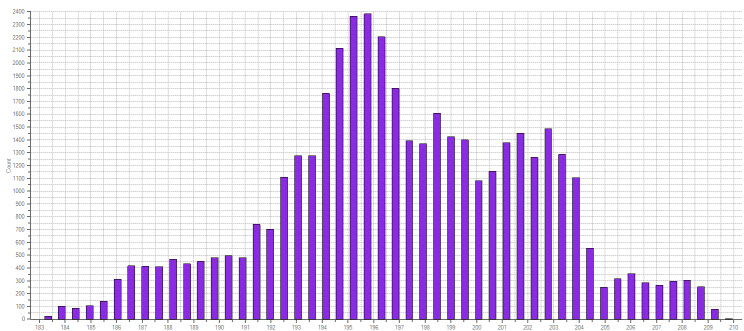
Above shows a simple example of a

  • Scatter plot, useful for seeing the relation between two variables. Bubble plots are scatter plots where the size of the dot is another variable and color as well, allowing for 4D view.
  • Trend plot, useful to seeing how variables “dance” through time, individually or in concert.
  • Histogram which gives you insights in how variables are distributed and vary in thier values or comparing between similar variables, such as before and after treatments where you are wanting to reduce variance.

These three chart types, and their variants (bubbles, 3D/4D scatters, trends) are sufficient to explore most data in manufacturing sufficiently to see and understand the process at least from a 2-4 variables at a time perspective. Beyond that, you need intelligent software built for the job to sort it out; Intellect Server.

Intelligent Modeling To Identify Key Drivers

Visualization runs out of gas at about 4 or 5 dimensions. They human mind cannot see and understand beyond this level of complexity. But your materials and process conditions number into the 100’s or 1000’s of variables. What do you do? Use intelligent modeling technologies… They can simultaneously consider extreme dimensionality, the large quantity of variables, including all interactions. You know there are a key handful of important variables, so you should start with those, however you may make discoveries about your operations you didn’t know by using many variables and using variable selection to winnow them down to what the data says is important. Your key variables should be in the list the Intellect system finds, but perhaps some you were not aware of.

Continue the Conversation with an Experienced Engineer?